Monitoring systems have evolved over time to support evolving architecture styles and deployment strategies
Generation X+1: Monolithic applications, Bare metal servers
This was the era where you would have single deployable unit for whole application (labeled as monolithic now). Application and the database would be deployed on a known set of bare metal servers. Vertical scaling was more favorable option for scaling
Nagios was(probably still is) the widely used open source monitoring software in this era. You would configure a list of known severs the monitoring system needs to probe to determine the health of the system. This system was simple to configure & operate
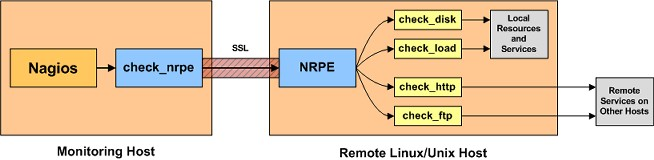
Image Credit: https://support.nagios.com/kb/article.php?id=141
Generation X+2: Service Oriented Architecture, VMs on the Cloud
Managing monolithic applications became painful as the businesses grew. Service Oriented Architecture(SOA) became mainstream in this era. Cloud services like AWS made it very easy to launch new VMs for deploying services. Configuration management tools like puppet, ansible made it easy to deploy applications across large number of servers. Immutable server pattern was evangelized by well known companies.
Horizontal scalability started becoming more favorable option for scaling. One could bring up new instances of service by launching VMs from a image(eg: AMIs) and bring down VMs easily depending on the load on the system. This deployment architecture demanded a monitoring system which can handle this dynamicity.
Monitoring systems like Sensu solved this issue with a different architecture style. Instead of a central server probing a static list of servers, sensu had a publish & subscription model using RabbitMQ. The monitoring agent running on the application server subscribes to monitoring check messages relevant for the service and pushes the results via same messaging system. Monitoring server itself was horizontally scalable to handle varying load
Image Credit: https://sensuapp.org/docs/1.0/overview/architecture.html
Generation X+3: Micro services, Container orchestration engines
Micro services are becoming mainstream now. Deploying stateless services as containers has made the concept of immutable servers very easy and efficient compared to using VMs. Container orchestration engines like kubernetes, docker swarm have made it easy to run and manage large number of services running as containers inside a cluster of servers. These orchestration engines also provide benefits like auto healing(restart on failure), easy to scale, in-built service discovery & load balancing.
Monitoring systems like sensu doesn’t fit well in this setup. Running a monitoring agent alongside the application process in a container adds additional complexity in containers. As service discovery is provided by container orchestration engines, there is no need for adding complexity of running messaging system for solving discovery problem
During the time when Google open sourced kubernetes(most popular container orchestration engine as of now), a new monitoring system - Prometheus (built by ex-googlers in soundcloud) started gaining lot of traction. Prometheus leverages service discovery mechanisms for registering services to be monitored. It has a lot simpler setup and smaller resource requirements compared to system like sensu. Prometheus factored the containers ecosystem and fits very well for the job. The scalability argument against pull model of monitoring was also addressed by the authors of the system.

Image Credit: https://prometheus.io/docs/introduction/overview/
Conclusion
If you are building a new system with architecture patterns and deployment strategies of this era, Prometheus is a leading choice among open source monitoring systems
PS: There are lot of good things(and few limitations) about prometheus which deserves separate blog post :)